
Power and Protection - Smart Electricity Grids at the Crossroads of Technology and Geopolitics
In an age of evolving energy demands, climate concerns, and geopolitical tensions, the modernisation of power grids offers transformative potential. This report, authored collaboratively by the Global Commodities Desk and the Emergent Technologies Desk, provides actionable insights into the opportunities and challenges of smart grids, highlighting their pivotal role in building a sustainable, secure, and interconnected energy future. The geopolitical and economic dimensions of energy policy underscore the dual role of electrical and cyber systems, calling for robust protective measures against emerging threats. Discover how cutting-edge technologies and strategic policies are driving the energy revolution—read the full report to learn how smart grids are reshaping power systems and redefining energy security worldwide.

Small Modular Reactors Nuclear Renaissance?
In the era of climate urgency, increasing energy demands, and geopolitical uncertainties, Small Modular Reactors (SMRs) could redefine the energy landscape and provide viable alternatives to current energy sources. SMRs present a scalable, safer alternative to traditional nuclear power. This report from London Politica explores the potential of SMRs to revolutionise energy production, mitigate climate change, and enhance energy security. With uranium prices soaring and global interest in nuclear energy surging, SMRs are poised to play a critical role in the nuclear renaissance.
Our comprehensive analysis covers key regions, including the US, Europe, and China, examining their nuclear strategies, regulatory landscapes, and market dynamics. We also delve into the controversies surrounding uranium supply chains and the broader political and economic implications of nuclear power. Dive into our in-depth analysis of the future of SMRs and their global impact.

Australian Mining in Crisis: Nickel’s Price Plunge
On February 16th, Australia added nickel to its Critical Minerals List to protect its mining industry from strong competition from low-cost Indonesian nickel. Indonesia’s nickel industry is expected to continue growing, backed by pursuant investments from China. Australia’s inclusion of nickel makes the mineral eligible for a 3.9 billion-dollar fund to support the minerals industries linked to the energy transition through grants and loans with low-interest rates. This inclusion is a response to the persistent downward trend of nickel prices that began at the end of 2022, caused by an increase in the supply of cheaper nickel produced in Indonesia. Nickel is used to manufacture batteries for electrical vehicles (EVs) and stainless steel. However, the low-profit margin of nickel exploitation, in combination with increased competition from Indonesia, is jeopardising the Australian mining industry and pushing investors away from Australian mines.
Chinese Investment Into Indonesian Nickel And Its Impacts On Australia
One of the biggest reasons for the global decline in nickel prices, which decreased by 45% in the past year, is Chinese investment in Indonesia. In 2020, Indonesia–which holds 42% of the global nickel reserves–reinstated a ban on unprocessed nickel exports to encourage onshore investment in its processing industry. Large multinational companies, such as Ford and Hyundai, invested in ore processing and manufacturing in the archipelago to access its nickel reserves. Indonesian lateritic nickel ore is attractive as it is closer to the surface than the sulphide ore found in Australia or Canada, making the required infrastructure to exploit it significantly cheaper. The sector received massive Chinese investments in various forms, such as refineries, smelters, and metallurgic schools, to develop the industry that had not previously evolved due to the lack of business know-how and financial investments. In 2022, Chinese investments accounted for 94.1% of the total foreign direct investments in the Indonesian reserves, as seen in the “Nickel Rush” chart below. The investments increased quickly after the ban on unprocessed Indonesian nickel in 2014, which was later eased. These investments boosted the production efficiency of Indonesian refined and semi-refined nickel, representing 55% of the world's total nickel supply in 2023 and potentially increasing its market share to 75% by 2030.
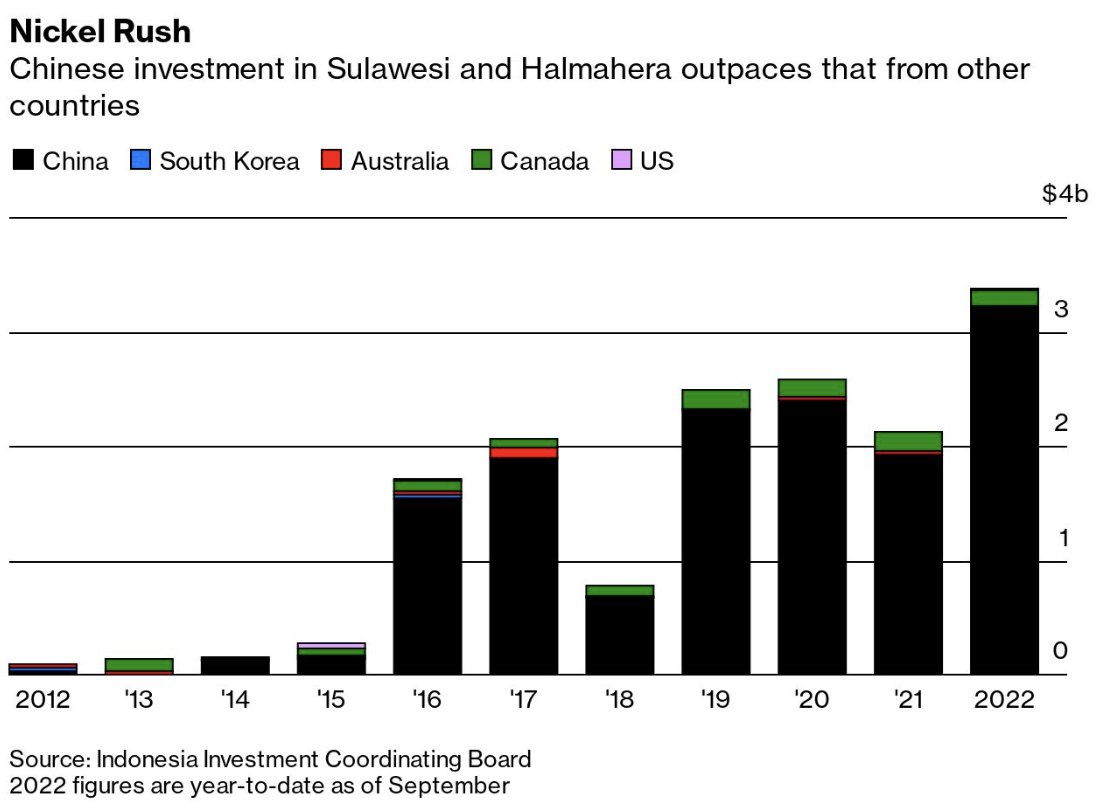
The chart can be found here.
The investment inflows towards Indonesian nickel also helped its laterite nickel ore to become more competitive compared to foreign ones. Primary nickel production is divided into two grades: (1) low-grade or Class II, which is used to manufacture stainless steel and found mainly in Indonesia, and (2) high-grade or Class I, which is used in batteries and can be found in Canada and Australia. While Indonesia has an abundant reserve of low-grade nickel, investments in the industry enabled its producers to apply sophisticated methods to upgrade its nickel to a higher grade. With the improved quality, this type of nickel can be used for batteries, after applying high temperature and pressure methods called high-pressure acid leaching (HPAL), allowing the Indonesian nickel to compete with other countries.
Global Challenges Impacting Nickel Demand
From the demand side, China, Europe, and the United States–Australia’s largest nickel importers—are simultaneously experiencing reduced demand for various reasons. The stainless steel market, which accounts for 75% of nickel use, was sluggish in 2023 due to a slow economic recovery in Europe and the US, which are still recovering from pre-COVID levels. Demand is set to increase by 8% in 2024, but the oversupply mutes its effects. As Sino-American tensions grow, China, the biggest EV market, faces deep and complex economic challenges, including a lack of trust from investors and buyers. Europe, the second biggest EV consumer, has seen the end of tax breaks and other government incentives to buy EVs. Moreover, the US’ high-interest rates prevent consumers from taking out loans, including for EV purchases. The combination of these factors is plummeting the aggregate demand for EVs, thus further pushing down nickel prices, an important mineral for EV batteries.
Consequently, Australian nickel mines are becoming uncompetitive at the current price range, with many even shutting down as nickel prices are expected to continue decreasing throughout 2024. The unit cost per ton of Australian nickel is 28% higher than in Indonesia. Also, while nickel prices decreased globally, its Australian production cost has increased by 49% since 2019, driven by rising wages. The London Metal Exchange (LME) listed nickel closed at US$16.356 per metric ton on February 16, a downward trend since its peak of around US$33,000 per metric ton in December 2022, as seen in the chart below. Companies such as IGO, First Quantum, and Wyloo Metals, some of the most prominent actors in Australian nickel mining, have pulled back investments or suspended part of their businesses.

Chart made by the author with data from Investing.com
These recent developments threaten the jobs of many Australian workers. BHP, the largest Australian mining company, recently announced it may take an impairment charge of around US$3.5 billion. The company plans to shut down its Nickel West division, which employs nearly 3,000 people. In total, the Australian nickel industry supported 10,000 jobs in 2023.
The situation is not exclusive to Australia. Eramet, a French mining company, lost 85% in revenue in 2023 in its New Caledonia nickel plant without any prospect of having government aid to increase its competitiveness. Macquarie, an asset management firm, estimates that 7% of the total nickel production has been removed due to closures. Even so, Australia will likely be the most affected. The country has 18% of global nickel reserves, but it is no longer competitive and is left contemplating the potential of its uncompetitive reserves.
The Debate Over 'Dirty' vs 'Clean' Nickel
There may be a solution to Australia’s nickel problem beyond access to the Australian Critical Mineral Facility Fund. Australian nickel producers are subjected to more strict sustainable standards than Indonesia, increasing costs. The refining of Australian nickel produces six times fewer emissions than other countries, including Indonesia. For these reasons, Madeleine King, the Australian Resources minister, urged the LME to split the listing of nickel into two categories: “dirty” coal-produced nickel and “clean” green nickel. Mining businessmen also demand this separation to motivate buyers to pay a premium for Australian and other nickel supplies with a smaller carbon footprint to level the competition against Indonesian nickel with this premium. This type of split in mineral contracts already exists, such as for aluminium and copper.
LME officials also declare that classifying minerals according to ESG criteria is a tough challenge given the lack of a universal ESG standard. Currently, carbon emissions per ton of the nickel listed in the LME vary greatly, from 6 to 100 tons of carbon dioxide per ton of nickel produced, and the lack of a standard makes it difficult to estimate the absolute emissions that would classify a nickel as “clean”. Currently, the LME classifies low-carbon nickel as producing less than 20 tons of carbon dioxide per ton, and it is working on a more precise definition with nickel specialists.
Reshaping the Australian nickel industry
It is unlikely that the LME will list green nickel separately from “dirty” nickel soon, given the liquidity threats this incurs. The broker wants to solidify buyers' confidence after the 2022 nickel episode before making changes that can jeopardise liquidity. LME officials stated in mid-March of this year that they have no plans to do so as the market size of a green nickel is not large enough to split it. On the other hand, Metalhub, a digital broker, recently started to split its nickel listing with the support of the LME. MetalHub allows the producers to have an ESG certificate tailored to their emissions per ton, which is more flexible than the LME ESG standards. The demand for the “clean” nickel in the digital broker would determine an index price used to derive the premium for this product type and delimit the liquidity of this trade contract. The digital broker plans to release the contract data when the volume traded increases.
It will be challenging to see nickel prices at levels that would make Australia's nickel mining industry competitive again. Indonesia is not hiding the fact that it wants to influence market prices with its nickel supply. According to Septian Hario Seto, an Indonesian deputy overseeing mining, the current price allows Indonesian nickel producers to sustain their activities. Also, low nickel prices will lower the costs of its emerging battery industry, completing the strategy to build an Indonesian upstream industry of batteries.
The access to Australia’s Critical Minerals Facility fund, in combination with the Inflation Reduction Act (IRA) from the US, brings the expectation of an increase in investment towards the nickel industry. The Australian fund will be crucial to leverage projects to reduce costs by increasing productivity and infrastructure efficiency related to high costs such as energy, water, high-skilled labour, and transport. Also, the US’ IRA is set to increase the demand for Australian nickel, as it obliges US industries to purchase 40% of its critical minerals needs from either domestic producers or countries with which the US has a free trade agreement–wherein Australia is one of them. The two, combined with ever-evolving environmental regulations leading to a greater demand for EVs, can bring the required financial boost for Australia’s upstream nickel production. However, it will be more difficult for its nickel downstream industry given internal inflation and external competition not only from Indonesia but from all the countries building plans to rebuild their national processing industries.
When it comes to nickel buyers, assuming standard market incentives, they will pay more if they see an advantage in buying a cleaner metal, such as government subsidies or a bigger profit margin on selling a greener EV. Summing up, Australia chose to include nickel in its Critical Minerals List, assuming a big part of the responsibility to protect the industry. The government is one of the stakeholders with the financial ability and the incentive to avoid adverse socioeconomic developments. Minister King is also working with counterparts to advocate for robust standards in production to be reflected in a price premium. These counterparts–namely the US, the EU, and Canada–have the same interest in building an alternative supply chain to the Chinese one. The combination of factors such as the Critical Mineral Facility Fund, the IRA, and a possible stable price premium will give much-needed relief to persisting uncompetitive problems faced by Australian nickel producers. This seems to be the beginning of a pathway towards enhanced competitiveness for Australian nickel miners and, possibly, more sustainable nickel standards.
Even so, more funds might be insufficient to make the Australian nickel miners more competitive. Indonesia has a competitive advantage with a low production price that incurs high costs to its citizens. Coal mines are being constructed to fuel energy-intensive activities to upgrade the Indonesian nickel, making the country reach record levels of coal consumption and carbon emissions. Rivers are contaminated with heavy metals from the mines and refineries, exposing inadequate waste disposals. Addressing these environmental and social costs will level up Indonesian nickel prices, indirectly benefiting Australia and promising relief for the communities burdened by these impacts.

A Strait Betwixt Two
As the Yemeni Houthi group's assault on maritime vessels continues to escalate, the risk to key commodity supply chains raises global concern. As analysed in this series' previous article (available here), conflict escalation impacts the region's security, impacting key trade routes and global trade patterns. The Suez Canal is a key trade route whose stability and security could impact and shift trade dynamics. As the search for alternative trade routes ensues, the Strait of Hormuz makes use of a power vacuum to expand its influence.
Suez Canal
The Suez Canal is a 193-kilometre waterway that connects the Red Sea to the Mediterranean Sea. Approximately 12% of global trade passes through the Canal, granting it vast economic, strategic, and geopolitical influence on a global scale. This canal shortens maritime trade routes between Asia and Europe by approximately 6,000 km by removing the need to export around the Cape of Good Hope and serves as a vital passage for oil shipments from the Persian Gulf to the West. Approximately 5.5 million barrels of oil a day pass through the Canal, making it a ‘competitor’ of the Strait of Hormuz.
Global trade via the Suez Canal is likely to decrease as a result of the rising tensions near the Bab el-Mandeb Strait. Due to their geographic predispositions, the Bab el-Mandeb Strait and the Suez Canal are interdependent; bottlenecks in either trade choke point will have a knock-on effect on the other. Bottlenecks caused by Houthi aggression against ships in the strait are likely to redirect maritime traffic from the Suez Canal to alternative passageways. From November to December 2023, the volume of shipping containers that passed through the Canal decreased from 500,000 to 200,000 per day, respectively, representing a reduction of 60%.

Suez Canal Trade Volume Differences (metric tonnes)
The overall trade volume in the Suez Canal has decreased drastically. Between October 7th, 2023, and February 25th, 2024, the channel’s trade volume decreased from 5,265,473 metric tonnes to 2,018,974 metric tonnes. As the weaponization of supply chains becomes part of regional economic power plays, there is a global interest in decreasing the vulnerability of vital choke points via trade route diversification. The lack of transport routes connecting Europe and Asia has hampered these interests, making choke points increasingly susceptible to exploitation.
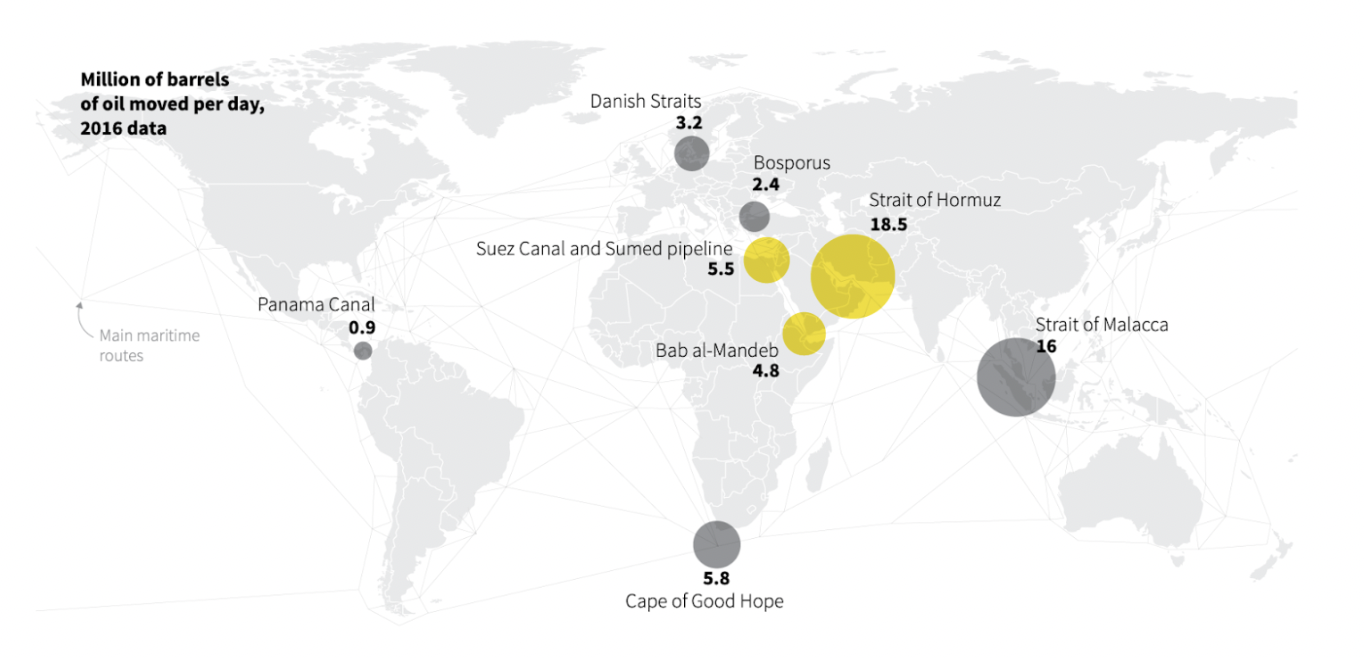
Oil Trade Volumes in Millions of Barrels per Day in Vital Global Chokepoints
Source: Reuters
Quantitative Analysis
Many cargoes have been rerouted through the Cape of Good Hope to avoid the Red Sea region since the beginning of the Houthi conflict. Several European automakers announced reductions in operations due to delays in auto parts produced in Asia, demonstrating the high exposure of sectors dependent on imports from China.
In the first two weeks of 2024, cargo traffic decreased by 30% and tanker oil carriers by 19%. In contrast, transit around the Cape of Good Hope increased by 66% with cargoes and 65% by tankers in the same period. According to the analysis of JP Morgan economists, rerouting will increase transit times by 30% and reduce shipping capacities by 9%.

Depiction of Trade Route Diversion
Source: Al Jazeera
More fuel is used in the rerouted freight, an additional cost that increases the risk of cargo seizure and results in elevated shipping rates. The most affected routes were from Asia towards Europe, with 40% of their bilateral trade traversing the Red Sea. The freight rates of the north of Europe until the Far East, utilising the large ports of China and Singapore, have increased by 235% since mid-December; freights to the Mediterranean countries increased by 243%. Freights of products from China to the US spiked 140% two months into the conflict, from November 2023 to January 25, 2024. The OECD estimates that if the doubling of freight persists for a year, global inflation might rise to 0.4%.
The upward trend in freight rates can be seen in the graphic pictured below, depicting the “Shanghai Containerised Freight Index” (SCFI). The index represents the cost increase in times of crisis, such as at the beginning of the pandemic, when there were shipping and productive constraints, and more recently, with the Houthi rebel attacks. Most shipments through the Red Sea are container goods, accounting for 30% of the total global trade. Companies such as IKEA, Amazon, and Walmart use this route to deliver their Asian-made goods. As large corporations fear logistic and supply chain risk, more crucial trade volumes could be rerouted.

Shanghai Containerized Freight Index
Energy Commodity Impact
Of the commodities that traverse the Red Sea, oil and gas appear to be the most vulnerable. Before the attacks, 12% of the oil trade transited through the Red Sea, with a daily average of 8.2 million barrels. Most of this crude oil comes from the Middle East, destined for European markets, or from Russia, which sends 80% of its total oil exports to Chinese and Indian markets. The amount of oil from the Middle East remained robust in January. Saudi oil is being shipped from Muajjiz (already in the Red Sea) in order to avoid attack-hotspots in the strait of Bab al-Mandeb.
Iraq has been more cautious, contouring the Cape of Good Hope and increasing delays on its cargo. Iraq's oil imports to the region reached 500 thousand barrels per day (kbd) in February, 55% less than the previous year's daily average. Conversely, Iraq's oil imports increased in Asia, signalling a potential reshuffling of transport destinations. Trade with India reached a new high since April 2022 of 1.15 million barrels per day (mbd) in January 2024, a 26% increase from the daily average imports from Iraq's crude.

Brent Crude and WTI Crude Fluctuations
Source: Technopedia
Refined products were also impacted. Usually, 3.5 MBd were shipped via the Suez Canal in 2023, or around 14% of the total global flow. Nearly 15% of the global trade in Naphta passes through the Red Sea, amounting to 450 kbd. One of these cargoes was attacked, the Martin Luanda, laden with Russian naphtha, causing a 130 kbd reduction in January compared with the same month in 2023. Traffic to and from Europe is being diverted in light of the conflict. Jet fuel cargoes sent from India and the Middle East to Europe, amounting to 480 kbd, are avoiding the affected region, circling the Cape of Good Hope.
Due to these extra miles and higher speeds to counteract the delays, bunker fuel sales saw record highs in Singapore and the Middle East. The vessel must use more fuel, and bunker fuel demand increased by 12.1% in a year-over-year comparison in Singapore.
In 2023, eight percent, or 31.7 billion cubic metres (bcm), of the LNG trade traversed the Red Sea. The US and Qatar exports are the most prominent in the Red Sea. After sanctioning Russia's oil because of the Ukrainian War, Europe started to rely more on LNG shipments from the Middle East, mainly from Qatar. The country shipped 15 metric tonnes of LNG via the Red Sea to Europe, representing a share of 19% of the Qatari LNG exports. Vessels travelling to and from Qatar will have to circle the Cape of Good Hope, adding 10–11 days to travel times and negatively impacting cargo transit.
US LNG export capacity has increased in the past few years, sending shipments to Asia via the Red Sea. The Panama Canal receives many LNG cargoes from the US via the Pacific, yet its traffic limitations cause US cargo to be routed through the Atlantic and the Red Sea. The figure “Trade Shipping Routes” below displays the dimensions of the shifts that US LNG cargoes must take in the absence of passage via the Panama Canal.
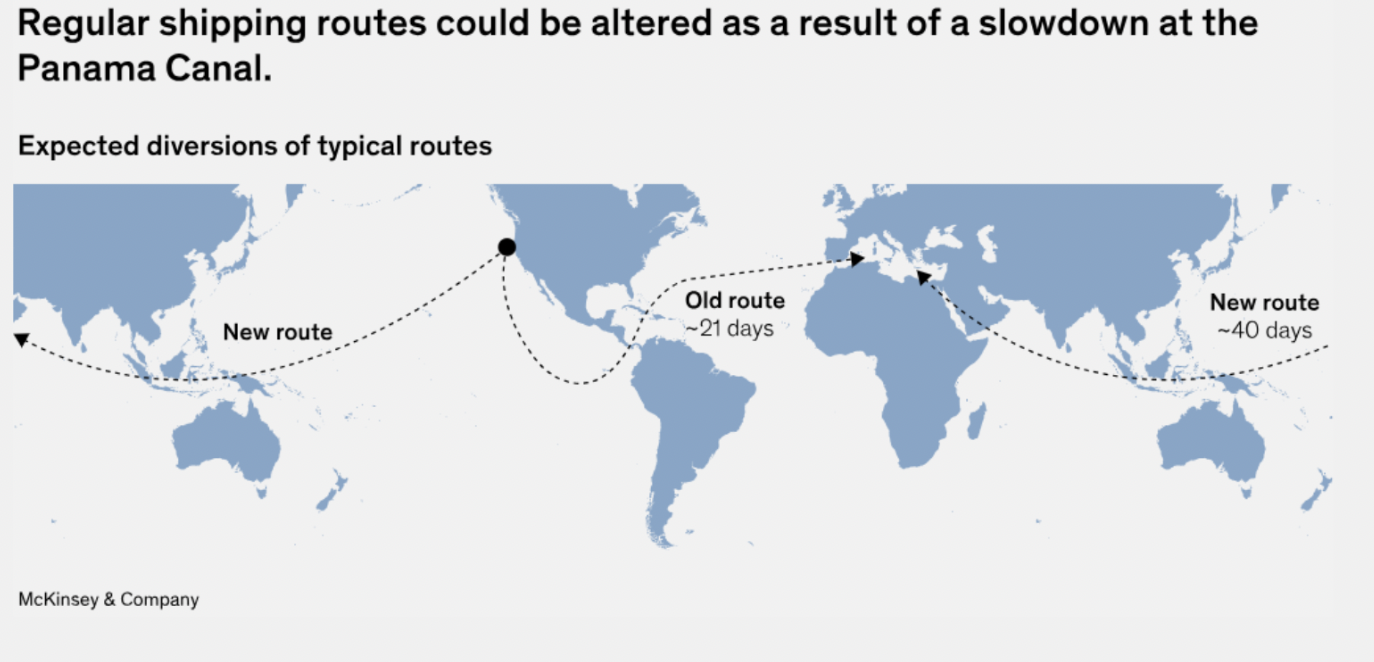
Trade Shipping Routes
Source: McKinsey & Company
Until January 15, at least 30 LNG tankers were rerouted to pass through the Cape of Good Hope instead. Russia's LNG shipments to Asia are currently avoiding the Red Sea, and Qatar did not send any new shipments in the last fortnight of January after the Western strikes at Houthi targets.
Risk Assessment
A share of 12% of oil tankers, ships designed to carry oil, and 8% of liquified gas pass through this route towards the Mediterranean. Inventories in Europe are still high, but if the crisis persists for several months, energy prices could be aggravated. As evidenced by the sanctions against Russia, cargo reshuffling is possible. Qatar can send its cargoes to Asia, and those from the US can go to European markets, allowing suppliers to effectively avoid the Red Sea.
Around 12% of the seaborn grains traversed the Red Sea, representing monthly grain shipments of 7 megatonnes. The most considerable bulk are wheat and grain exports from the US, Europe, and the Black Sea. Around 4.5 million metric tonnes of grain shipments from December to February avoided the area, with a notable decrease of 40% in wheat exports. The attacks affected Robusta coffee cargoes as well. Cargoes from Vietnam, Indonesia, and India towards Europe were intercepted, impacting shipping prices and incentivizing trade with alternative nations.
Daily arrivals of bulk dry vessels, including iron ore and grain from Asia, were down by 45% on January 28, 2024, and container goods were down by 91%. However, further significant disruptions to agricultural exports are not expected. Most of the exports from the US, a large bulk, were passing through the Suez Canal to avoid the congestion of the Panama Canal due to the droughts that limited the capacity of circulation. These cargoes are now traversing the Cape route.
Around 320 million metric tonnes of bulk sail through Suez, or 7% of the world bulk trade. No significant impacts are predicted for iron ore or coal, which represented 42 and 99 megatonnes of volume, respectively, shipped through the Red Sea in 2023. Most of the dry bulks that traverse the impacted region can be purchased from other suppliers, precluding significant supply disruptions.
As of March 1st, reports show that only grain shipments and Iranian vessels were passing through the Red Sea. There were no oil or LNG shipments with non-Iranian links in the Red Sea. These developments illustrate the significant trade shifts caused by the Red Sea crisis. As of today, a looming threat lies in the Houthis’ promises of large-scale attacks during Ramadan. The lack of intelligence on the Houthi’s military capacity and power makes it difficult to ascertain the extent of future conflicts, generating further uncertainty in commercial trade.
The Strait of Hormuz
The Strait of Hormuz is a channel that connects the Persian Gulf to the Gulf of Oman, providing Iran, Oman, and the UAE with access to maritime traffic and trade. The strait is estimated to carry about one-fifth of the global oil at a daily trade volume of 20.5 million barrels, proving to be of vital strategic importance for Middle Eastern oil supply the world’s largest oil transit chokepoint. The strait is a prominent trade corridor for a myriad of oil-exporting nations, namely the OPEC members Saudi Arabia, Iran, the UAE, Kuwait, and Iraq. These nations export most of their crude oil via the passage, with total volumes reaching 21 mb of crude oil daily, or 21% of total petroleum liquid products. Additionally, Qatar, the largest global exporter of LNG, exports most of its LNG via the Strait.

Geographic Location of Strait of Hormuz
Source: Marketwatch
Although the strait is technically regulated by the 1982 United Nations Convention on the Law of the Sea, Iran has not ratified the agreement. Through its geostrategic placement, Iran can trigger oil price responses through its influence on trade transit, establishing the country’s regional and global influence.
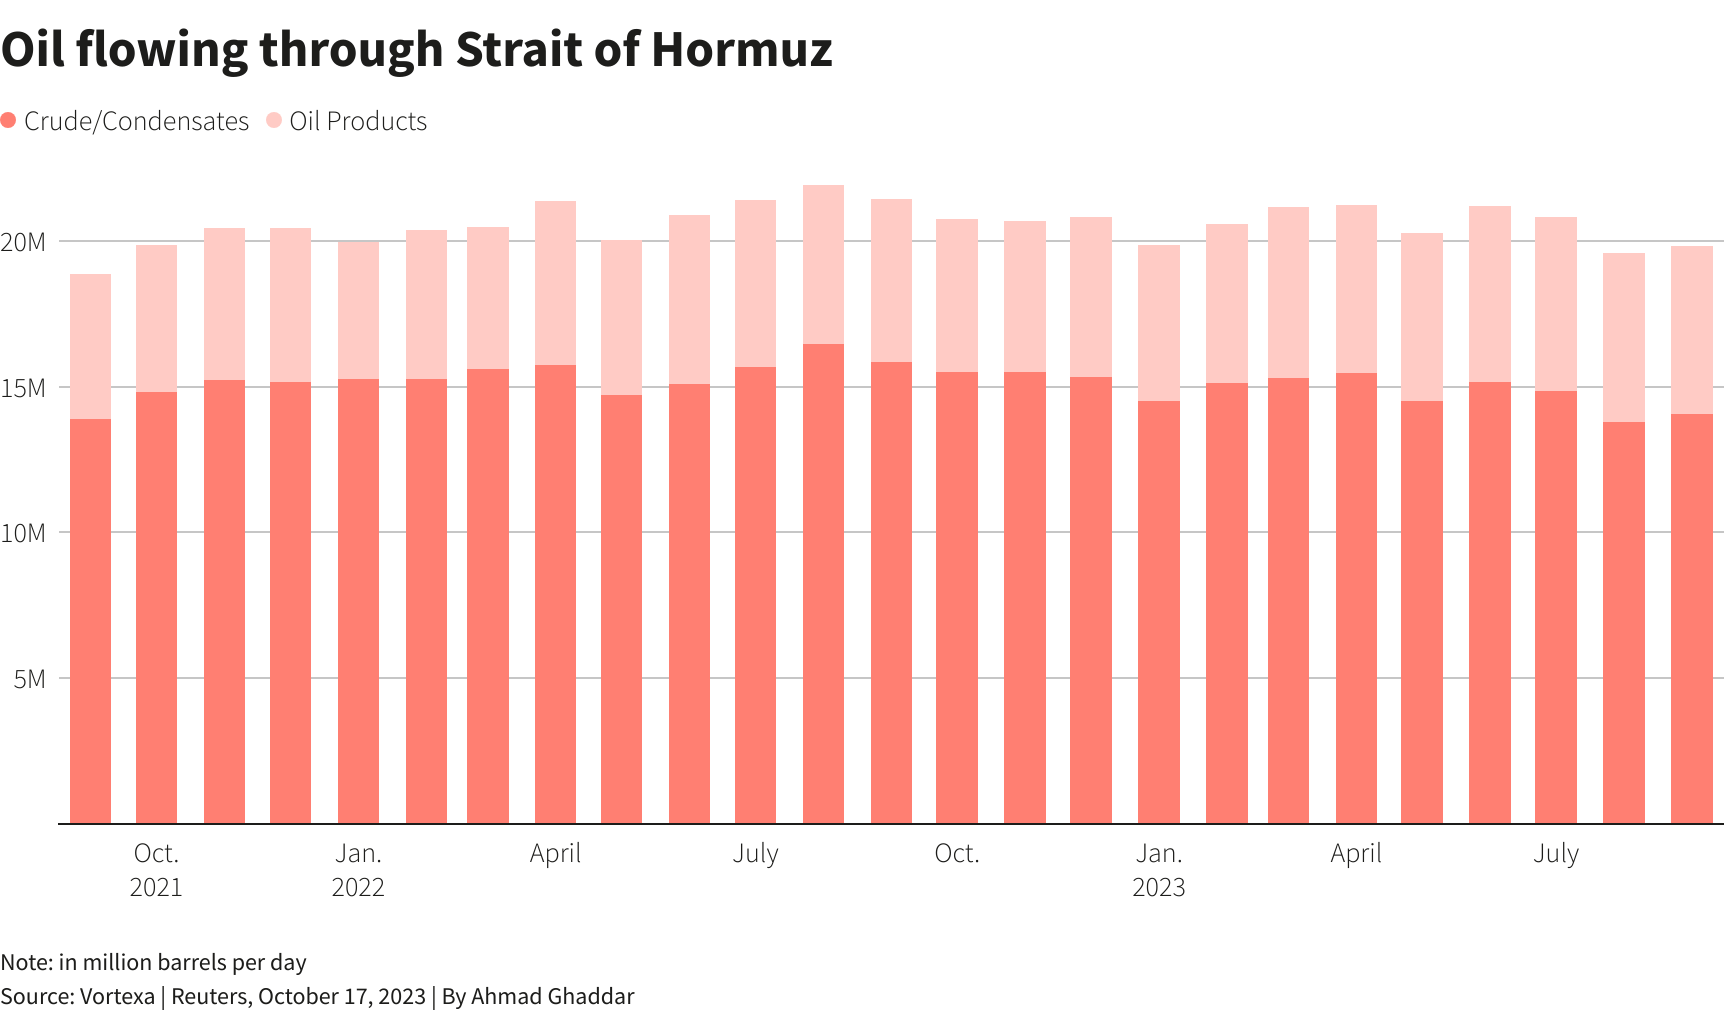
Strait of Hormuz Oil Volumes
Source: Reuters
Experts are particularly worried that the turbulence is likely to spread to the Strait of Hormuz now that Iran backs the Houthis in Yemen and might want to support their cause by doubling down regionally. However, this is something that would cause a lot of backlash in the form of a further tightening of economic sanctions against Tehran, which might deter further provocations.
Despite Iran’s previous threats to block the Strait entirely, these have never gone into effect. Diversifying trade routes to avoid supply shocks and bottlenecks is of interest to regional oil-exporters dependent on the route for maritime trade access. Such diversification attempts have already been undertaken, as seen by the UAE and Saudi Arabia's attempts to bypass the Strait of Hormuz through the construction of alternative oil pipelines. The loss of trade volume from these two producers, holding the world's second and fifth largest oil reserves, respectively, severely hindered the corridor’s prominence.
The attacks on the Red Sea might cause damage to the oil and LNG cargo from countries in the Persian Gulf, increasing costs for oil and gas exporters. However, cargoes could find alternative destinations. The vast Asian markets, which face a shortage of energy products due to a loss of trade through the Red Sea, could be a potential suitor. Finding new LPG (liquefied petroleum gas) contracts could be beneficial for Iran, and its recently enhanced production capacity could supply various markets.
Geopolitics and Prospects for a Route Shift
Although the Strait of Hormuz stands to capture diverted trade flows from the Suez Canal, its global influence is still limited by Iran’s geopolitical ties. As exemplified by the Iran-US conflict, Iran’s conflicts can severely impact traffic through the Strait, significantly impacting the stability of the route and prospects for future growth.
Although security and stability are of paramount importance to trade, efforts to provide these traits could be counterproductive. On March 12th, China and Russia conducted maritime drills and exercises in the Gulf of Oman with naval and aviation vessels. According to Russia's Ministry of Defence, this five-day exercise sought to enhance the security of maritime economic activities using maritime vessels with anti-ship missiles and advanced defence systems. Over 20 vessels were displayed in this joint naval drill, attempting to lure trade through the promise of stability and security.
Whether meant as a display of power or a promise of security, the pronounced presence of Russian and Chinese forces could aggravate geopolitical tensions and increase the potential for conflict in the region, driving global trade prospects down. With precedents of trade conflict, such as the IRGC’s seizure of an American oil cargo in the Persian Gulf on January 22nd, various countries might be sceptical of rerouting commodity trade through the Strait.
Tensions are also aggravated by Iran’s alleged assistance in the Houthi attacks. The US has supposedly communicated indirectly with Iran to urge them to intervene in the region. China and Russia’s interest in improving the Strait’s trade prospects would benefit from a de-escalation of the Houthi conflict, as shown by China’s insistence on Iran’s cooperation in the Houthi conflict. As the conflict stands, the Strait’s prospect as an alternative trade route is dependent not only on Iran’s reputation and presence in global conflicts but also on the route’s patrons and proponents.
Conclusion
The extent to which the Strait of Hormuz could benefit from trade diversion depends not only on its ability to pose itself as a viable trade route but also on the duration of the Houthi conflict. In order to capture trade volumes and increase international trade through the route, Iran would have to ameliorate its geopolitical ties and provide stability to compete with rising prospective trade route alternatives. Although the conflict in the Suez has yet to show promising signs of de-escalation, securing the Suez would likely cause previous trade volumes to resume and restore its hegemony in commodity trade. It remains to be seen whether the conflict will endure long enough to allow other trade routes to be established as alternatives and permanently shift power balances in global trade.
2024 Elections Report: Risks & Opportunities for Commodities Sector

In the ever-evolving landscape of global commodities, the year 2024 stands as a pivotal juncture marked by transformative elections across diverse regions. As nations prepare to cast their ballots, the outcomes hold the power to shape policies and strategies that will significantly influence energy, trade relations, and resource management worldwide.
This report encapsulates the intricate intersections between political shifts and their repercussions on the commodities sector. London Politica’s Global Commodities Watch has made a selection of the most significant countries, and analysed the potential impact of elections based on election programmes, past policies, and scenario planning.